The Financial Impact of Turnover and
Dis-Engagement
Googling the cost of turnover produces gaudy numbers like “38% of shareholder value”…numbers so large that none of us can relate to. But it is likely that employee turnover and the cost of employee disengagement would rank among each company’s top five costs…or higher. More importantly, these costs are unbudgeted, under the radar of those that CFOs bring to the top team’s attention each month with stern conversations about required spending cuts due to down revenues and other factors.
The costs of turnover and disengagement are outside of any financial reports so they go un-noticed. Yet they appear in reduced sales, terrible service, and other factors that drive customers away.
The Role of Dollar Values in Retention
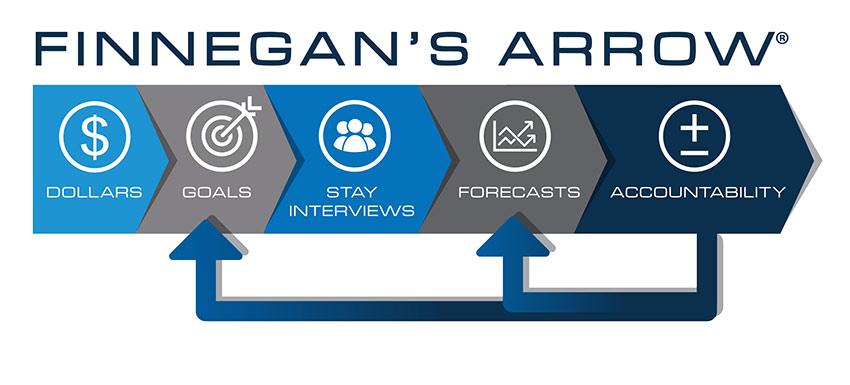
Finnegan’s Arrow, pictured below, is C-Suite Analytics’ guidebook, the pathway upon which all retention and engagement solutions are built. BusinessWeek Magazine has declared Finnegan’s Arrow “offers fresh thinking for solving the turnover problem in any economy”.

A key strategy in Finnegan’s Arrow is to calculate turnover’s cost because historically HR professionals have presented turnover and engagement in percentages and survey scores which had zero bottom-line meaning to their CEOs. These executives would take strong remedial actions only when they could place the dollars going out the door within the context of their other, more familiar challenges as in, “You mean when we lose just one employee it costs us as much as gaining three new customers? We better fix this!”
Said another way, for most companies striving to improve employee engagement and retention, there is a problem of translation.
So “Dollars” is the first component of Finnegan’s Arrow, because educating executives on the cost of turnover or disengagement is required for tops-down, executive-driven change. Dollars are calculated on two proprietary calculators, one for turnover and one for engagement, and C-Suite Analytics requires clients to include both HR and Finance to in all cost determinations. Once costs have been established, executives are then driven to establish retention or engagement goals, followed by leading their tops-down leadership teams to implement Stay Interviews, forecasting, and ultimately accountability for leaders to achieve their goals and develop accurate forecasts.
More information is available regarding these proprietary calculators here:
What is the greatest lesson from the “Dollars” component of Finnegan’s Arrow?
Engagement SCORES & Turnover PERCENTS have little impact on your executives compared to DOLLARS…and the single most important thing you want those executives to do is hold managers accountable for the engagement and retention of their teams in meaningful ways.
