Angela Duckworth’s research on GRIT reveals why passion and perseverance – not talent –predict workplace success. As baby boomers retire and younger workers enter with lower grit, engagement drops, and retention challenges intensify. Learn why retaining your best employees matters more than ever.
Calculating Turnover’s Highest Cost: Lost Productivity
This discussion should be especially interesting for anyone charged with reducing turnover.
First, We Should be Calculating Turnover as Dollars Not Percentages
Our company’s Finnegan’s Arrow model is the spine for each of our retention solutions. It’s the starting point for each action we take with our clients, laying out a solution sequence that you can see here:
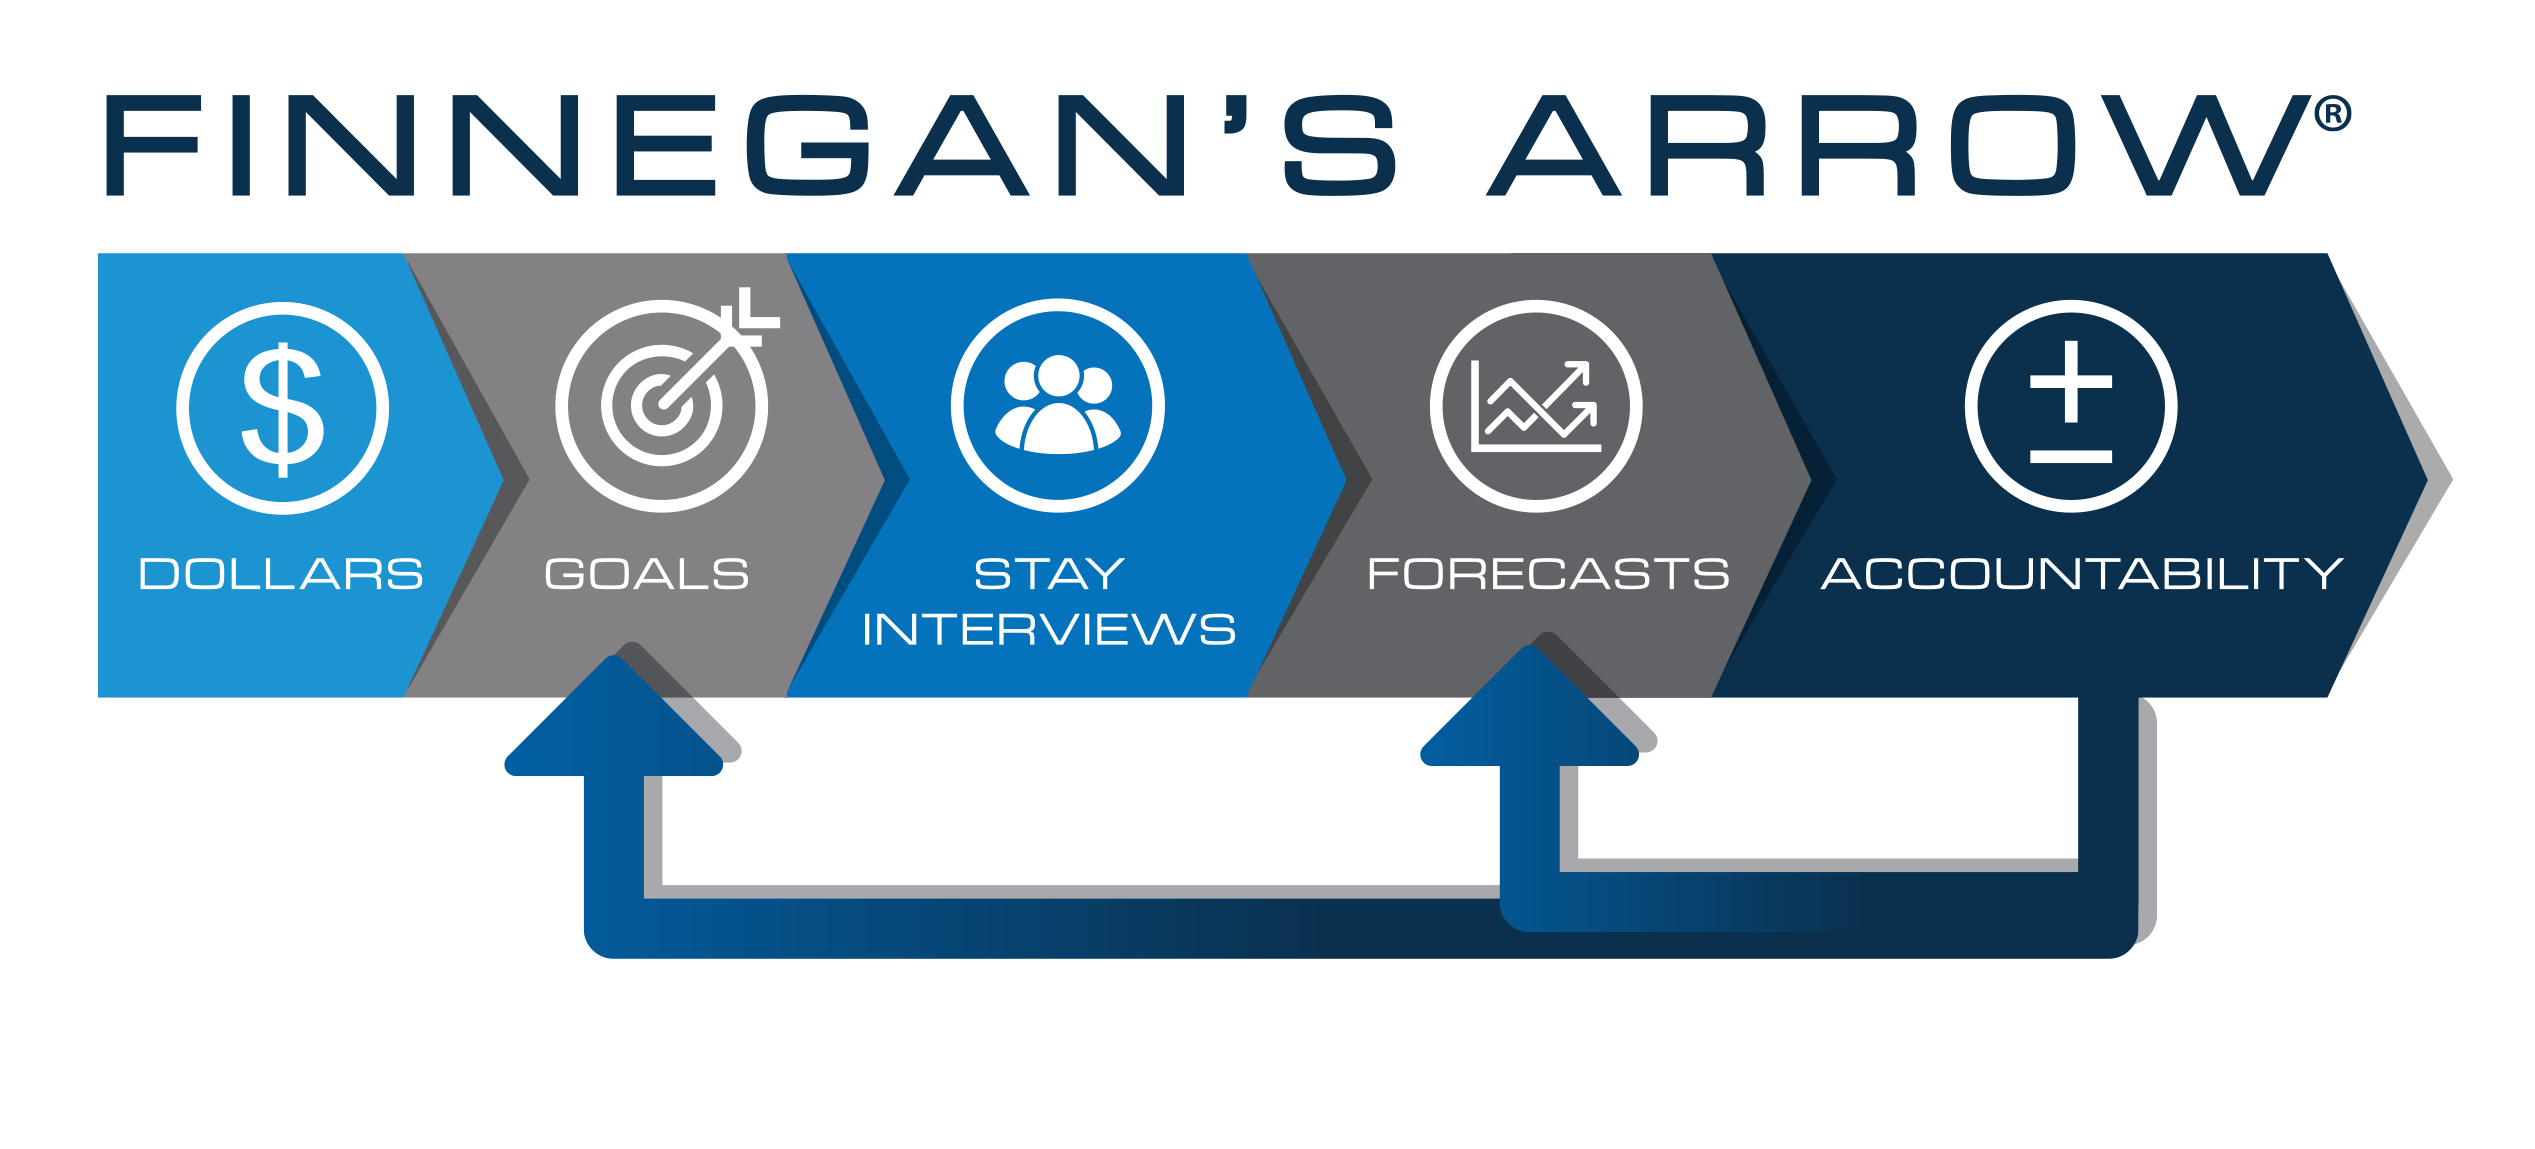
Note that we start with “Dollars” because we’ve learned over many years that any retention initiative must be sustained, must stick over time rather than become the flavor of the day. And the way we ensure our efforts grow deep roots at the top is to place a dollar value on turnover. And maybe most importantly, we require finance to participate in that turnover cost calculation.
We think of CFOs…chief financial officers…as master whisperers, meaning what they say in executive meetings carries great weight. Even though some CFOs I’ve worked with hardly ever whispered about anything. And here’s a message we say to CFOs about their roles in turnover…and please, CFOs, don’t take offense:
CFOs go to work each day trying to find the quarters in the couch. You search your screens each morning for ways to increase revenue and cut expenses, finding those micro solutions that eke out a nickel here and a nickel there. And you do this while turnover is costing your companies millions of dollars, and those leaking millions of unbudgeted losses are usually assigned to HR down the hall.
This is what CFOs have been trained to do. Not once have I met one who studied in college how to measure the cost of turnover. Not once.
Imagine walking down a city street and someone approaches you speaking in Japanese. Bewildering as this would be, it’s not far from HR reporting turnover to their c-suite in percentages that are not translated into dollars. CEOs speak dollars, it’s their language, and they don’t immediately connect the dots when turnover is reported as a percent.
Even worse is when turnover is reported against outside benchmarks, as in “Our turnover for this period was 24% but the industry benchmark for this period was 25%”. The usual c-suite outcome then becomes, “Great! We’re winning!”…when the truth is you are just one skinny percentage point from being mediocre. And that winning belief is just enough to stifle improvement actions from the top.
Calculating Turnover’s Cost
So let me make this easy for you. Our free turnover cost calculator is available from our home page. I’m copied on any entry made and I will email you with suggestions if I see ways you can use our calculator better.
Our calculator will measure the cost of turnover for one targeted job you choose. Our calculator is detailed, comprehensive, and will sort each data point you enter into two ultimate turnover cost categories which we call direct costs and lost productivity. Direct costs are the ones you would typically associate with turnover such as temporary help, overtime, recruiting, advertising, drug tests, training, onboarding, and more. When designing a turnover cost calculator, measuring direct costs is the easy part.
Calculating the Cost of Lost Productivity is More Complex
Placing a dollar value on lost productivity is more complex…but actually more important. Any executive including CFOs can readily see that losing an employee and hiring another costs money for training, for recruiting, for new uniforms and more. The deeper mystery is how much do we lose when a job remains open for weeks or months so the work must be done by others…or not done at all. And the same can be said for new hires ramping up, filling the job in those early weeks when that new hire cannot possibly replace the productivity of the employee who left.
The reality is no one can calculate lost productivity precisely. But our model provides a very good-faith estimate that few CFOs have ever disagreed with. The calculation is based on the assumption that all company revenue is provided by all company employees…and here’s how it works:
- Enter your organization’s most recent annual revenue divided by total FTEs, and your CFO will have these figures; our model offers a standard figure based on the Saratoga Institute’s database which is $240,000, but use your company’s amount instead.
- Divide that resulting amount by 240 which is the average number of days your employees likely work in a year, resulting in your now knowing the average daily revenue value for each employee in your company; if your input for #1 above is $240,000, you have now learned that the average employee contributes $1,000 to revenue each day.
- But we of course want to know the daily value for your targeted job vs the average job…so we will assume the value of your targeted job is based on how much you pay for that job relative to other jobs; for example if the average annual comp and ben for all jobs in your company is $50,000 and your targeted job pays an annual average of $100,000 in comp and ben, you would double the daily value for your targeted job; in our example your targeted job would now be valued at $2,000 for daily revenue.
So how many days should we apply for lost productivity? Think of these days in two buckets:
- The number of work days the job stays open, the days when no one is being paid for this job.
- And the number of work ramp-up days divided by 2 since the new hire is contributing more each day on an increasing scale; a good hint is to estimate ramp-up days conservatively determining how many days until the new hire can do the job’s basic duties independently.
Now add A + B, and then multiply the result times the targeted job’s daily revenue to learn the targeted job’s gross daily revenue. Moving that figure from gross to actual…and final…requires subtracting any funds you spent for temporary help or overtime which you did to buy productivity, and also subtracting the pay and benefits you saved for those days while the job was open.
Study the logic first, but don’t get hung up on the math complexity because our online calculator is programmed to do the math for you. The calculator will also add the direct costs to the lost productivity and you will then know the total cost of turnover for your targeted job.
Let’s close by taking a helicopter up 5,000 feet to realize what we’ve just accomplished. Now your CFO and subsequently your total c-suite have taken the first step to see turnover as an extreme and un-budgeted expense…in dollars…providing the wake-up call for your executives to take intentional, accountability-driven actions to reduce employee turnover. And that’s why “Dollars” are first on our Finnegan’s Arrow comprehensive turnover solution.
How Much is Turnover Costing You? Do You Need Help Sharing Its Importance with Your C-Suite?
Schedule a conversation with me at DFinnegan@C-SuiteAnalytics.com to discuss your turnover concerns and I’ll share ideas for how you can move forward using dollars instead of percentages and benchmarks to get your C-Suite team’s attention. It’s working for other companies in every type of industry to cut turnover by 20% and more.
Related Posts