Angela Duckworth’s research on GRIT reveals why passion and perseverance – not talent –predict workplace success. As baby boomers retire and younger workers enter with lower grit, engagement drops, and retention challenges intensify. Learn why retaining your best employees matters more than ever.
The Best Data Chart to Cut Your Turnover
As our clients know, the key to cutting turnover is transferring one’s thinking from finding the retention “thing”…benefits, time off, hybrid work, whatever…to seeing your leaders as the “thing” because the number one reason employees stay or leave is how much they trust their boss. Plus their leader, or let’s say first-line supervisor, is the only thing they can’t easily replace at another work location.
Those leaders then learn they are tracked against two retention goals, all turnover and new-hire turnover, and we train them to conduct Stay Interviews to learn what they can do to make their employees’ workdays better. This is the trust-building process…to ask five deeply-researched questions, listen carefully, probe to convert those five questions into twenty questions, take notes, and build what we call a “stay plan”. A stay plan might include helping the employee learn a new skill or resolving a conflict with a colleague. While a few employees might say “I’m OK” and need nothing from their leader, most will disclose an issue that their leader can address…and by doing so build that day-to-day trust that lengthens that employee’s stay with that organization. So leaders should develop a stay plan for most employees but not all.
We also ask leaders to forecast how long each employee will stay. Our method is traffic-light simple as green represents more than a year, yellow six-to-twelve months whether voluntary or involuntary, and red zero-to-six months. Leaders can update their forecasts anytime based on learning new information.
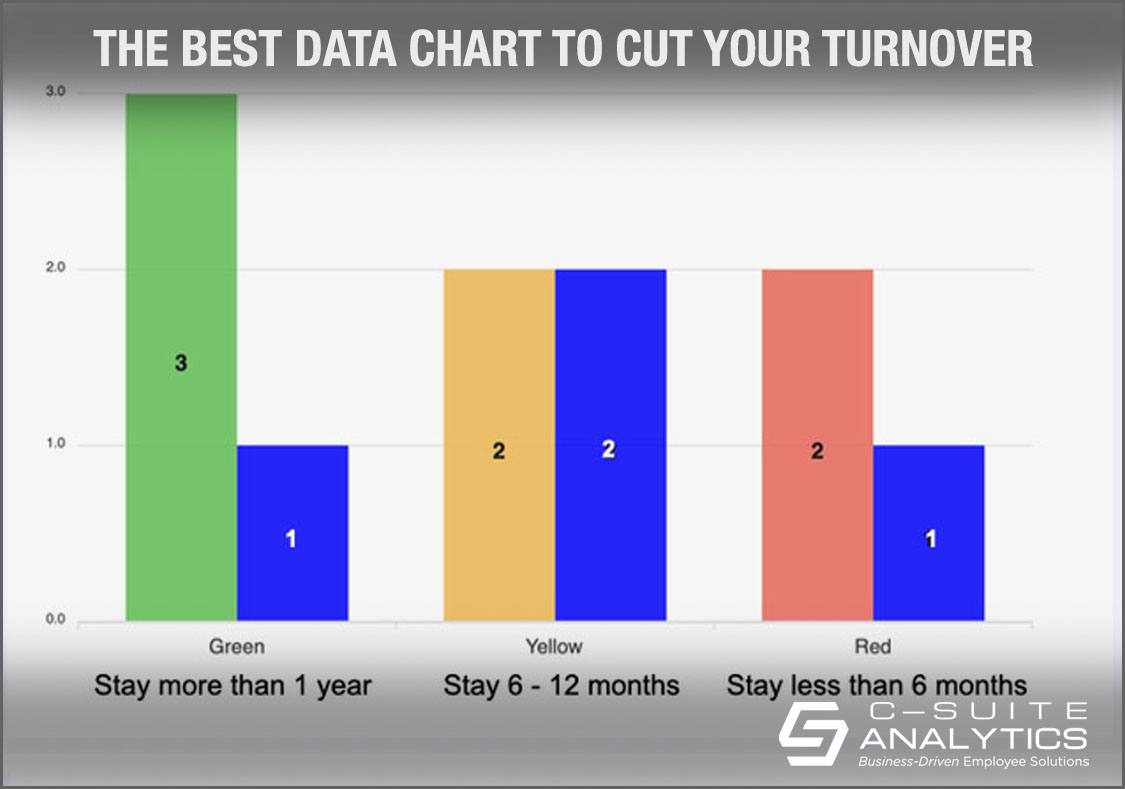
The Best Turnover Data Chart Ever
The key to cutting turnover is leader accountability. My own wake-up call happened decades ago when working in HR for a large banking company. Facing large turnover discrepancies from branch to branch, we realized managers were the only variable…so we asked them to accept and meet a retention goal versus raise pay or provide any other solution. They complained initially but then turnover fell off a cliff.
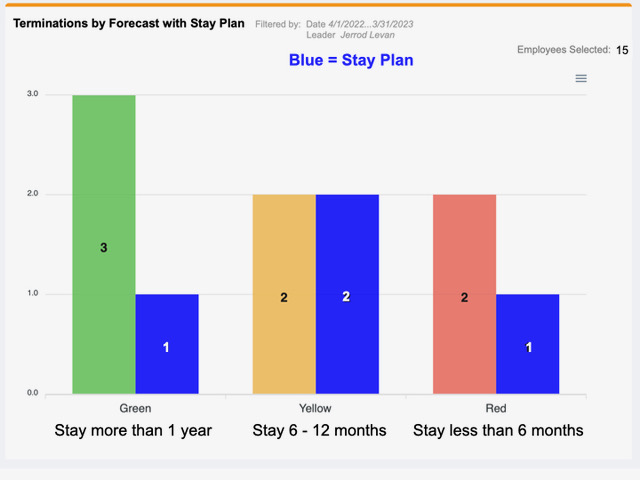
The chart below is one of several we’ve built that reports terminations, and these termination reports are available by organization, by department, and each leader who has any direct reports. This is a first-line leader termination chart that tells us the following:
- This leader has 15 direct-report employees.
- This leader has lost 7 employees during the past year.
- Of those seven, the forecast distribution was 3 greens, 2 yellows, and 2 reds.
- And 1 green had a stay plan, 2 yellows had a stay plan, and 1 red had a stay plan.
Here are questions you might ask if you were this leader’s manager:
- Is this leader making or missing her annual turnover goal? Losing 7 out of 15 employees represents an annual turnover rate of 47% which is high for white collar work but not for food processing.
- If 3 of 7 exits were forecasted green indicating the leader thought these employees would stay at least one year, how closely does this leader know her team? And how effectively does she conduct her Stay Interviews to learn details of why each employee might stay or might leave? Might it be that her team doesn’t trust her?
- And since she lost 3 greens, does it seem right that just 1 had a stay plan? The same question might be asked for the yellows and reds.
These are just starter questions, and you can begin to see the richness of data when reviewing it across full departments and total organizations.
Turnover Data Shows Top Stay & Leave Reasons
After each Stay Interview we ask leaders to choose from a drop-down box up to three reasons each employee stays or might leave.
This data not only provides direction for broad-scale retention improvement, but I believe it replaces any engagement survey report because of its source. These are each leader’s beliefs that are input immediately after listening to their employees’ Stay interview responses…versus gathering data annually that represents each employee’s opinions during the one hour they are completing the survey.
You Can Cut Turnover by 20% or More, No Matter Your Industry
There is an established solution for employee turnover…start here to learn our comprehensive turnover solution. Then schedule a conversation with me at DFinnegan@C-SuiteAnalytics.com.
Related Posts